Car Sales Dashboard
The dashboard is based on the customer sales report. The sales report consists of various information in regard to customer profile and transaction detail.
From the report, some of dashboard pages are created in which each page covers a certain topic, which are:
- Sales Summary
- Salesperson Performance
- Showrooms Performance
- Sales Information Detail
*The values shown are dummy data
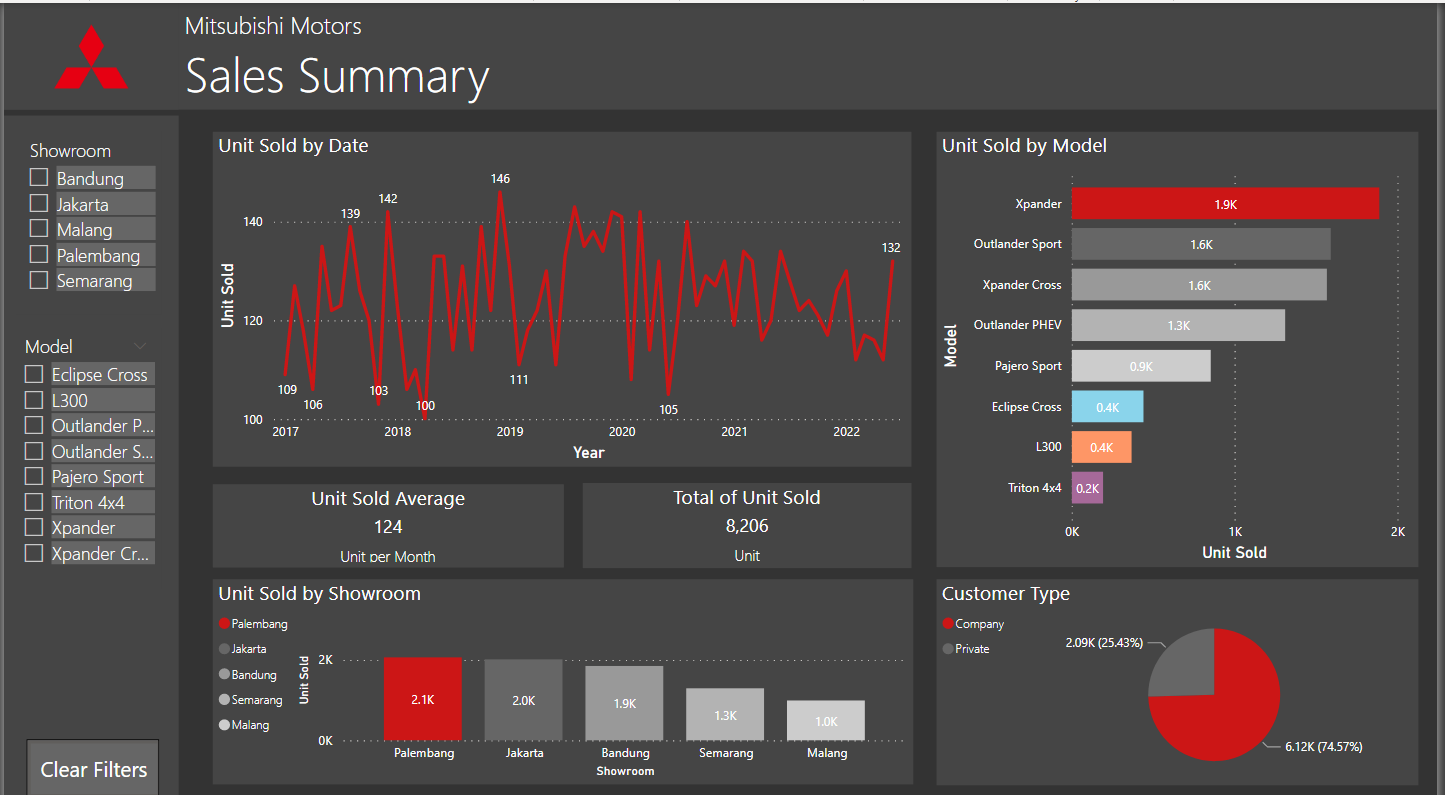
The above image is the Sales Summary page of the dashboard. Basic information includes graph of sold unit by yearly basis, most car models sold, customer type proportions and bar graph of unit sold by showroom branches. There are some visualizations that requires measurement using DAX functions such as monthly averge unit sold.
Using the source data and transform it into time-series data, the further analysis about the trend and seasonility are obtained and the forecasting of future values are generated. Therefore, three dashboard pages are created from seasonal and trend decomposition and forecasted result, that is:
- Seasonality and Trend
- Car Model Forecasting
- Showroom Branches Forecasting
*The values shown are dummy data
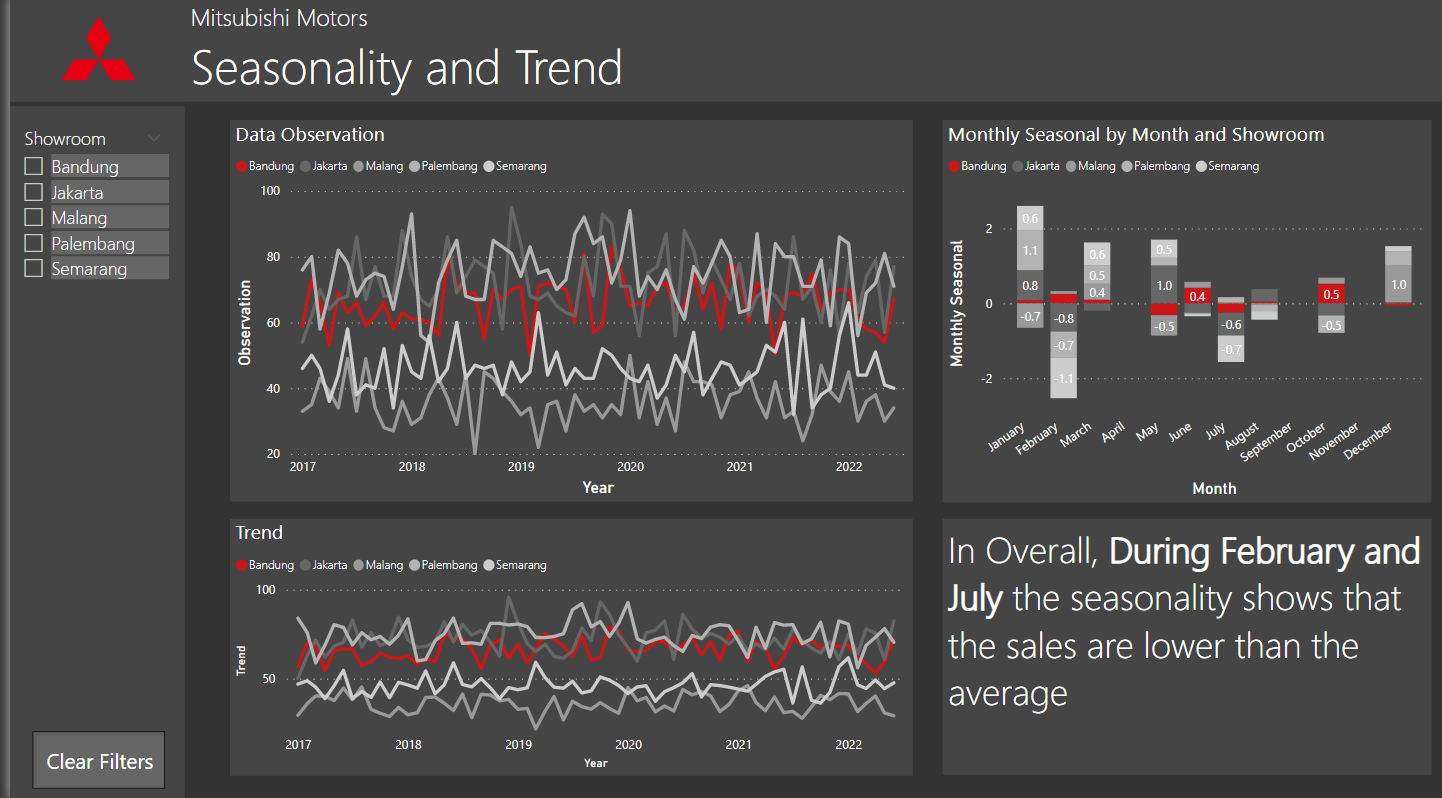
The above image shows the Seasonality and Trend dashboard page. The page shows the decomposition of time-series data of based on sales quantity and date. The trend and seasoanility, as well as a short summary on the right bottom part allow the user to analyze the sales pattern in a particular time of year.